$—
Value range & condition band
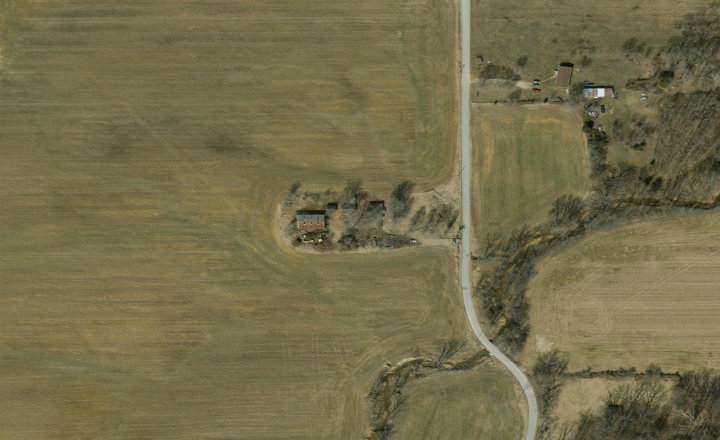
A genuine rural homestead.
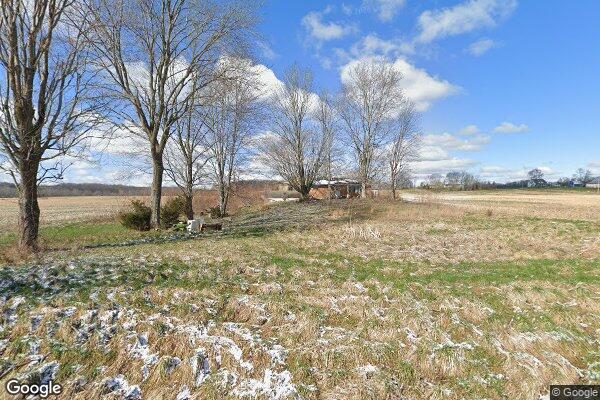
What sits on the land.
County cost record (assessor external-only, 05/11/2023): replacement cost new, depreciation, and contributory assessed value per structure.
| Improvement | Detail | Built | Size | Grade | Depr | RCN | Assessed |
|---|
What bare acreage trades for.
Bare-land & small-tract sales, time-adjusted −6%/yr to the as-of date — the red chip is the time mark-down (land is softening). Each row links to Zillow and its county parcel record.
Adjusted $/acre · subject reference line
adopted $9,200/ac dashedThe primary evidence.
Homes on acreage, time-adjusted +4%/yr (green chip = appreciation). This set carries the most weight — subject pinned at top, county-confirmed close matches badged.
PrimaryAdjusted sale vs acreage
subject ★ in blueEvery sale, restated to today.
Each comp is brought to the as-of date: land softening (Purdue, red ▼) and residential appreciation (FHFA / IAR, green ▲), applied per comp.
Per-comp time adjustment
gain ▲ green · loss ▼ redToday's order book.
Current competing supply — homes-on-acreage and bare land. Figure shows the ask; the chip shows days-on-market.
Every record, checked twice.
All 30 comps + listings resolved to their county parcel record; Zillow acreage cross-checked vs county acreage. Status flags divergence severity.
| Comp | County | Parcel | Zillow ac | County ac | Δ | Status |
|---|
A third, MLS-fed read.
An independent third source — realtor.com's MLS-fed sold records (RDC Frontdoor GraphQL, read-only) — checked against the Zillow + county-GIS figure for each comp realtor.com carries. The same realtor.com listings supply the photo thumbnails throughout this report.
| Comp | Recorded $ (Zillow/county) | realtor.com $ | realtor.com date | 3-way verdict | Source |
|---|
Source
The neighborhood, at a glance.
Subject, sold comps, active listings, and the 1 / 3 / 5-mile rings. Tap any marker for sale data and dual records links.
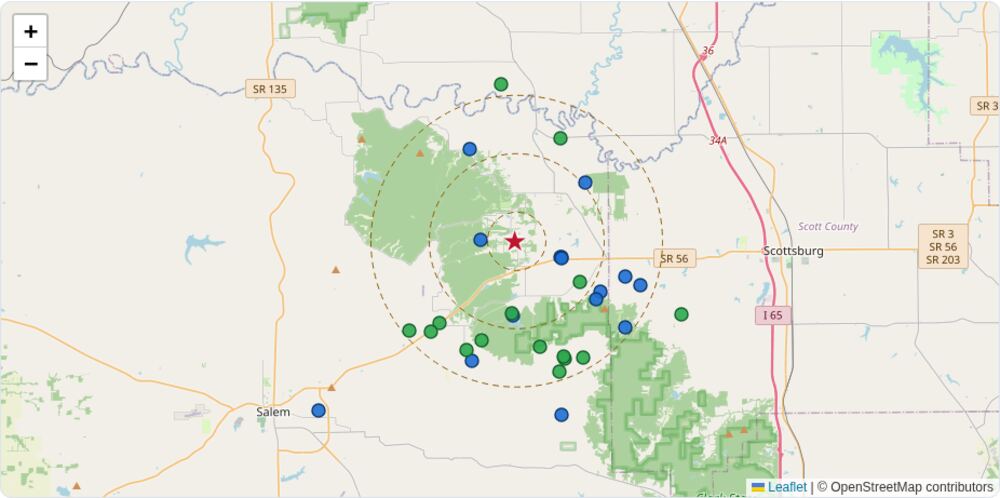
Proximity: comps + listings by ring
subject at centerThree reads, one number.
Three methods triangulated: the improved-comp read (primary), depreciated cost (floor), and the excluded 2020 bulk transfer.
| Method | Tag | Computation | Indicated value | Weight |
|---|
Where the number lands
method ranges · recommended markerThe work behind the opinion.
The analysis pipeline, the limits of a desktop CMA, and full source provenance.
Sources